Free velocity based training 1RM calculator and logbook
Free training tool. Log all your workouts, bar speed data and RPE in one place with this spreadsheet training resource.
Introducing the Velocity Logbook v3.1
***
November, 2024, A note from VBTcoach: The Velocity logbook is now back available with version 3.1
You can get a copy of the 1RM calculator spreadsheet when you sign up for the free resources on this website.
***
The first edition of the logbook has been a huge success, helping people all around the world get more out of their training by enabling relatively easy storage and logging of velocity data.
But it was time for a refresh, the version 1.0 logbook has had now been replaced with the new and improved logbook v3.1!
The logbook is still free and openly available, you get a copy the minute you sign up to the VBTcoach newsletter at this link.
Thanks also to Andrew who reached out and repurposed my logbook adjusting the layout to suit his powerlifting training. It was his concept that first inspired the logbook re-write.
You can find a link to the set up guide for this shortcut at the bottom of this article, first, let’s explore all the features available within the velocity logbook v3.1.
And if you prefer to watch instead of read here is the instructional video:
Works with any bar speed tracking device or app
The Velocity Logbook has been designed to work seamlessly with data from any bar speed tracking device or application on the market, whether you’re using a linear position transducer, accelerometer-based system, or camera-based velocity tracking solution this logbook will work into your flow seamlessly.
This universal compatibility means you can use your preferred velocity based training device or apps – from high-end systems like Perch and GymAware through to budget conscious devices like Vitruve or precise phone based applications like Metric.
Inspired by Metric
All features in the Velocity Logbook were inspired by our work developing Metric, the bar speed tracking app that I cofounded.
While this free logbook brings powerful VBT tools to the community, it’s worth noting that these same features are available in a seamless, automated format in the Metric iOS app.
The app eliminates the need for manual data entry while providing real-time analytics and instant feedback during your training sessions. Metric is free to use, while Pro and Coach memberships with advanced features are also available.
Download Metric for iOS here → · Download Metric on Google Play →
Customisation of the display
There can be a lot going on when you start training with VBT, so to help with this take some time to customise your logbook hiding any columns you might not care about much in your training.
As an example, my own logbook is significantly stripped back, I don’t train with RPE, or am not worried about velocity loss so I hide these columns showing just the readiness score, the curve score and the velocity PR columns. These are the numbers that matter to me in my training and give me a very quick overview of how the session is tracking.
Automatic Profiling and 1RM estimation
The biggest improvement introduced to the new logbook is the addition of real-time profiling scores within the main logbook pages.
The first logbook had a profiling tool, but it was separate from the logbook tool. Initially this was meant to be a tool that coaches or athletes might use occasionally outside of their training sessions, offering the option to explore your VBT data further, estimating 1RM, looking at your curve score and more.
Velocity based training 1RM calculator and profiling tools
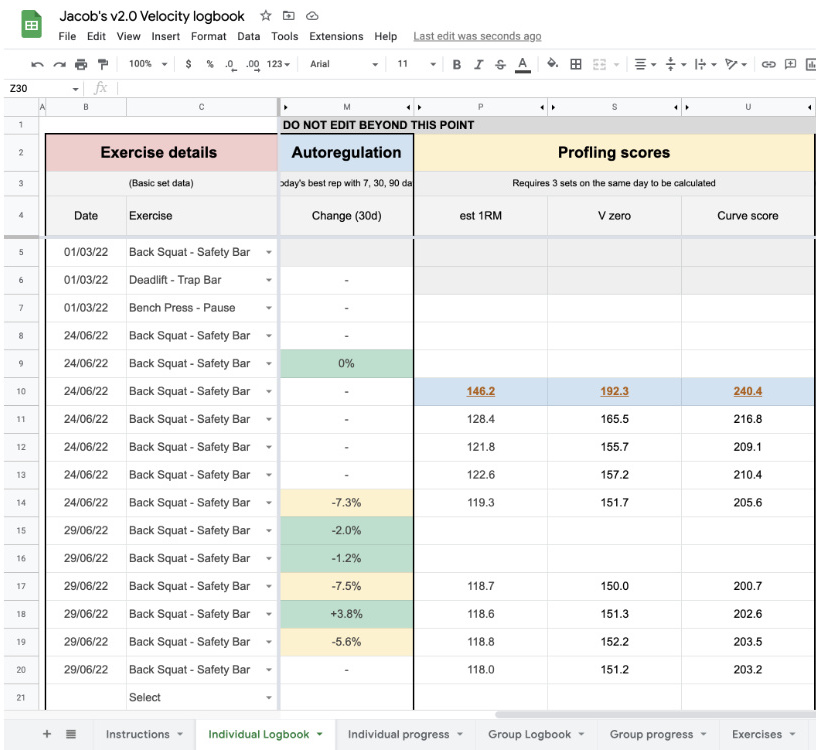
With the new logbook, profiling scores are now calculated automatically as data is entered into the logbook, making it a seamless part of the training process. Once three sets of an exercise are entered for a given day the profiling tool will calculate and display an e1RM, and curve score, providing performance insights during that exercise for today’s training session.
You can use these profiling results to then judge readiness by comparing today’s score with your recent history or use it as a programming tool, planning the days percentage training values from your estimated 1RM after the final warm up.
Your best ever score for each of the profiling columns will be flagged by turn blue, with bold gold coloured font to signify this new all time high score.
*NB: The equations used to estimate these profiling scores are not very sophisticated. As a result, it may occasionally deliver scores that are clearly inaccurate, especially after the 3rd set, or when you complete many sets of a similar weight. If this occurs, the best option is to simply delete the cell that contains the outlier score so that it does not unfairly impact your performance trends or your personal best high score.
Learn more about these profiling scores in this blog →
Personal best highlighting
The velocity logbook is designed to be an easy to use training log that you can simply glance at and very quickly pick up any trends in the data.
To achieve these the logbook relies on colour coding of some cells highlighting performance compared to your all time best or to a recent average.
The first colour to be across is the blue cells, which is applied to any cell whenever a new personal best is equalled or passed. This blue fill and bold, gold font is applied to the load, reps, best-rep velocity, e1RM and Curve score columns, indicating your best performance on a given exercise or exercise-load combination.
![]()
The blue cells are your personal bests for load, reps or best-rep velocity
In the early stages of logging your velocity data you will likely see lots of blue personal best cells, but over time this will settle down as you begin accumulating more and more training data in the logbook. If you want feel free to pre-enter a few of your known personal bests in the first few rows of the logbook to give the sheet same baseline data as a reference, this way you will truly know when you have earned a new personal best!
Contextual traffic lights
Inspired by the Trends feature in Metric, contextual readiness is a powerful way to see your real-time readiness and recovery between workouts. Personally, I think this is the most important column in the entire logbook.
These columns form the foundation of a great autoregulation system, helping you flag high fatigue levels (red and yellow cells) early in a workout and potentially adjust your session plan to match.
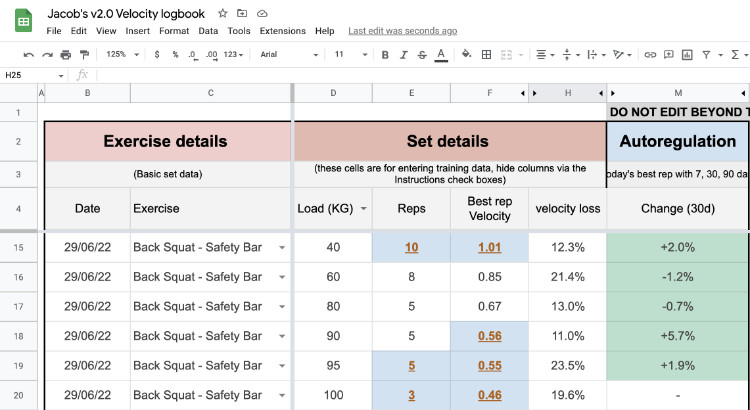
This is a good session, many blue cells (personal bests) and the green cells indicate good velocity compared to the 30-day average
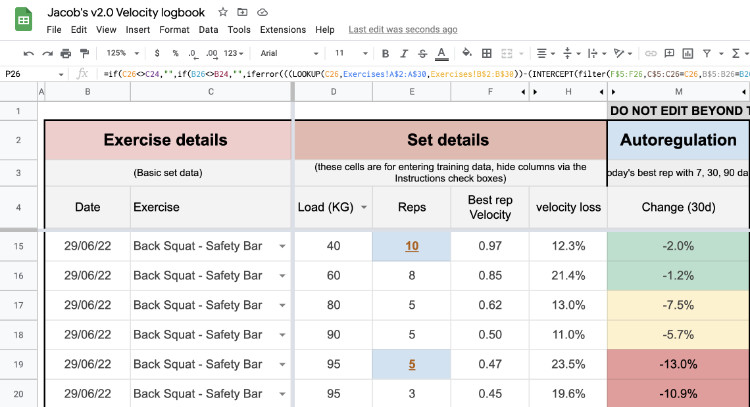
This is a bad session, few blue cells (personal bests) and the yellow and red cells indicate velocity is tracking poorly compared to the 30-day average
The cells show a percentage value calculating the difference between today’s velocity and the corresponding recent average. The traffic light colour system is based on three thresholds.
- Green: above -2.5%. This is the threshold for normal readiness. It takes a “near enough is good enough” mentality, hence you don’t have to be above your recent average, just close enough will do.
- Yellow: between -2.5% and -7.5%. This is the middle range, maybe you are a little fatigued, maybe you just aren’t fully warmed up, use these values to be alert, but not yet alarmed
- Red: Under -7.5%. A red cell indicated a potentially low performing set has just occurred. This should trigger a careful examination of your fatigue and readiness levels. Multiple red cells in the same session might be cause for a reduction in training stress to enable more recovery.
Progress graphs
The v2.0 logbook has also seen an improved and extended progress tracking sheet, with a chart for profiling scores and trend available alongside the existing load-velocity trend chart.
The original velocity progress chart functions by selecting an exercise and a given load. It then filters and shows all best-rep velocities by date to go with a trend line in performance over time.
The second chart allows you to filter and show all instances of profiling scores for a given exercise. This then charts all the scores you have achieved and a trend line to highlight change over time.
![]()
Progress in velocity on a 90kg Safety bar squat, notice an upward trend across the three sessions
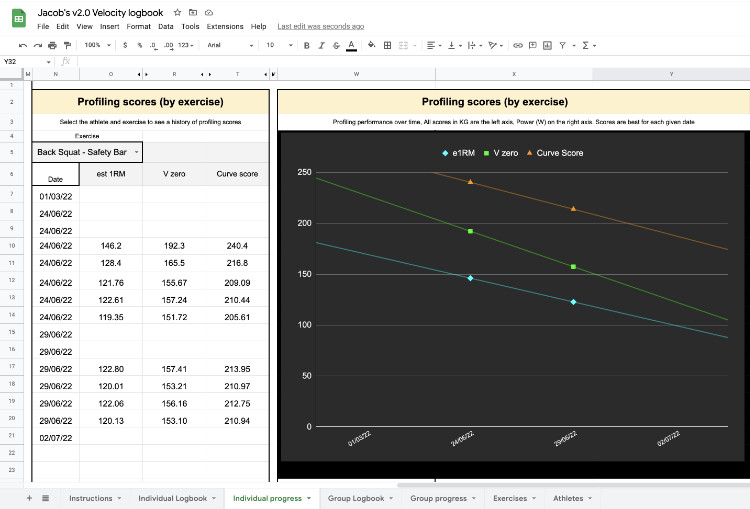
Progress on a safety bar squat with profiling scores and e1RM. In this example the trend is going down, suggesting a poor session or an accumulation of fatigue
Exercise database
The exercises within the dropdown are taken from the exercise list at the back of the document, this list matches the exercises available within the current Metric app. Feel free to add more to the bottom of the list if you need.
You will also notice a secondary column that requires a minimum velocity threshold value to be entered. I have put some rough values in place for you already, but again you may choose to customise these to your own needs.
Learn more about MVT values here →
*NB: Changing the MVT for an exercise will change all e1RM calculations past and future. It also applies the same MVT to all athletes in the group sheet.
Athlete names for the group logbook are pulled from the Athletes sheet, simply enter the names of your athletes into this and they will show up in the dropdown toggle for the groups logbook and progress page. You can have up to 100 athletes entered.
Get your free logbook and 1RM prediction tool
The logbook is available for free, just sign up for the VBTcoach newsletter and I will send you a copy right away!
Get a copy of the logbook here →
Level up with Metric - all the logbook features fully automated
For athletes and coaches seeking the ultimate velocity-based training solution, Metric remains the gold standard, offering everything available in the velocity logbook and more, in a fully automated integrated bar speed tracking and workout logging app.
With externally validated precision, incredible ease of use, real-time analytics, profiling and estimated 1RM, Metric goes beyond what any manual logging system can provide.
The Pro version eliminates manual data entry while adding sophisticated fatigue monitoring and predictive analytics to optimize your training sessions.
For Metric Pro coaches, the app also includes advanced team management features allowing you to program and manage your athletes in-gym or remotely by providing Metric Pro access to all your members.
Download Metric for iOS here → · Download Metric on Google Play →