The relationship between load and velocity is at the very heart of velocity based training. When it comes to human beings moving barbells, for any given movement, the more load a person attempts to lift, the slower that load will move.
This relationship is called the load velocity profile and it holds true on virtually all strength exercises.
The load velocity profile is stable and consistent, because of this there are a number of calculations and applications that can help coaches and athletes track progress, monitor fatigue, and optimise training in the short and long-term. All without the need to schedule a single testing day, in fact, load velocity profile can be collected every single session without changing anything about your workout routine.
What is a load velocity profile?
The load velocity profile, is the relationship between how much weight is on the barbell (in kilos or pounds), and the speed of which that barbell can be moved (most often mean velocities in metres per second (m/s)). For most lifters on most typical strength exercises this is an almost perfectly linear relationship.

This stability and consistency makes the load velocity profile a great tool for tracking progress, flagging weaknesses, monitoring fatigue, and measuring performance through profiling scores, such as the e1RM in almost any strength training settings.
It’s important to note that while the load velocity profile is stable and consistent, it is unique to individuals and exercises. No two lifters will have exactly the same profile in absolute or relative terms. This means creating a profile for each athlete individually is important but allows for comparison between and within athletes over time.
Types of velocity based training chart
While this article focuses on the load velocity profile, it's worth mentioning a few different types of profiles and related terminology within the velocity base training space.
Difference between load velocity and force velocity profile
As discussed above, the load velocity profile is a specific VBT chart generated from velocity data in a test or workout for an individual athlete, on an exercise, capturing their ability on that movement at a given moment in time. It's grounded in real data and shows actual performance from a single session.
This is not to be confused with the force velocity profile (also called the force velocity curve), a theoretical concept that describes your power generating potential across all movements.

This distinction is important and confusion on these two concepts has led to the misuse and over generalisation of the velocity zone theory.
The load-power profile
Another profile to briefly mention is the load power profile, a curved graph showing the relationship between load lifted and the amount of power produced in watts.
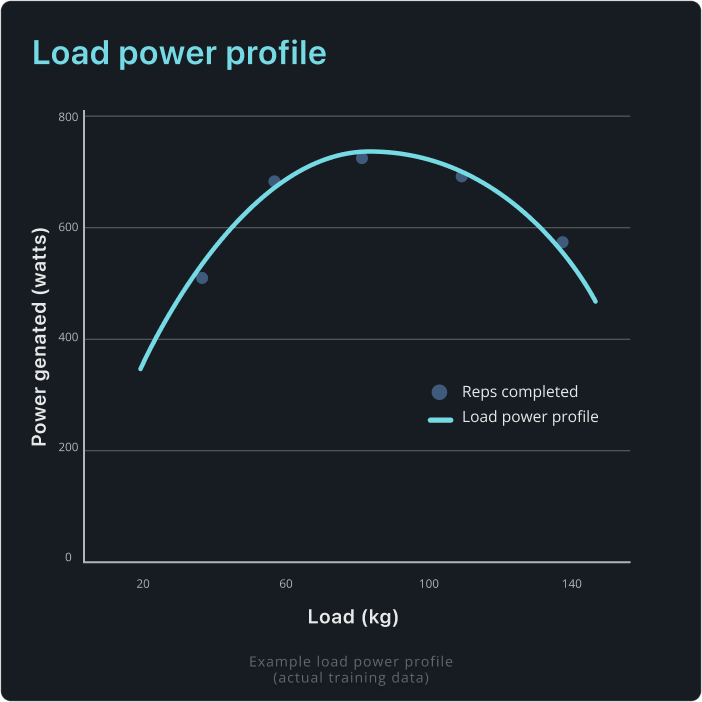
Much like the load velocity profile, the load power relationship is also incredibly stable and useful for training prescription. Unlike the relationship with velocity, the power-load relationship has a polynomial shape, with a point of maximum power occurring in the moderate loaded range. Depending on the exercise and individual variations, the point of max power can be anywhere from 30-80% of 1RM for most common strength and power exercises.
How to create a load velocity profile
The best part about load velocity profiling is that the only thing different you need to do is collect barbell velocity data. No extra set or specific testing days booked.
This makes profiling with VBT an attractive performance tracking method that can be applied at any time of the season without any additional fatigue accumulation or interruption to training flow.
Even better if you use the Metric VBT app data collection and profiling is done fully automatically.
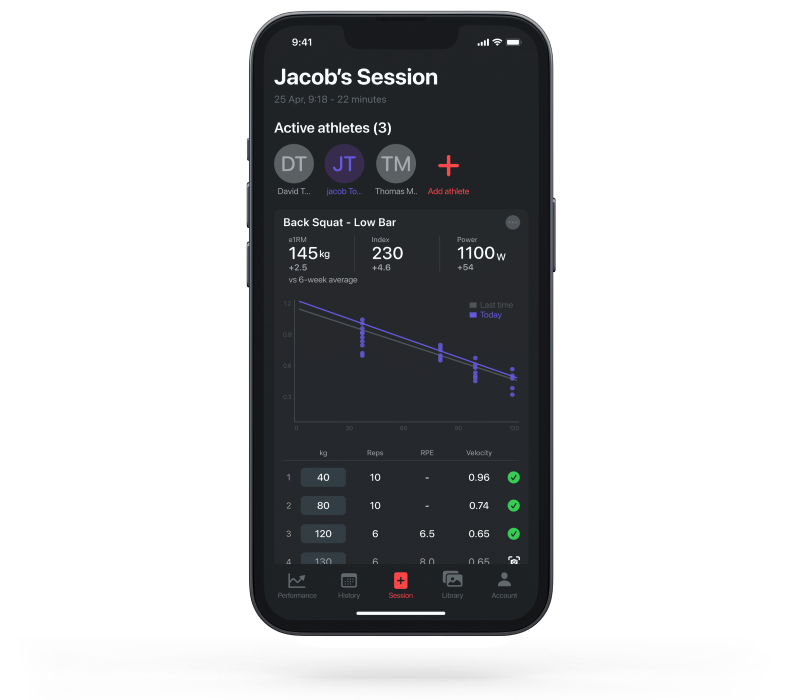
Automatic profiling in the Metric VBT app
The first thing you'll need to create a load velocity profile is a precise velocity based training app or device to track your bar speed data with.
My personal preference here is to use the Metric VBT app with a Pro or Teams account. Metric has automated profiling and data storage included. Simply start a workout, record velocity on your preferred exercise, and once you have three or more sets completed Metric delivers your load velocity/power profile. It even shows a comparison with last sessions profile versus today's profile.
If you use a different VBT device or app, the next best option is to input the data for each set into the free profiling calculator available here on the VBT coach website →
Train as normal profile collection
Because all the data analysis and storage is done automatically in Metric VBT, profiles can be generated every single workout, allowing you to easily accumulate significant amounts of data to track trends with precision and detect changes rapidly.
This means every single workout becomes a low stakes testing event. Simply train as you normally would and collect velocity data from all the sets, including warmups.
As an example it might look something like the following:
Back Squat load-velocity profile (e1RM of 135kg):
- Set 1: 20kg x12 - no data collected (warm-up)
- Set 2: 40kg x4 - best rep 1.02m/s - 380W
- Set 3: 80kg x4 - best rep 0.83m/s - 542W
- Set 4: 100kg x4 - best rep 0.61m/s - 521W
- Set 5: 115kg x4 - best rep 0.46m/s - 485W
Check out this video to see Pro basketballer Rach Brewster go through a load velocity profile as part of her workout. This is her normal ramp up series of warmups and work sets.
For a profile to be valid and reliable the following criteria need to be met:
- At least 3 sets across a range of loads. This is easily done by simply collecting velocity data from both warmup and work sets on a given day.
- One set above 75% of 1RM. At least one of the sets used in the profile should be above 75% of your 1RM. This moderately heavy set is important to ensure the individuals profile is valid. Without this set, a weak athletes can have an inflated profiling scores.
- Use best rep velocity/power from each load. Metric does this automatically, otherwise just scan the set reps for the highest mean velocity value.
- When coaching, be ready to eliminate any cheat reps from the profile. Bouncing or flicking the bar, shortening ROM, and other reps with poor technique should be removed from the profiling data set. In Metric you can hide reps by pressing the minimise button.
Specific testing session protocols
If you prefer to have specific testing days, you can absolutely still run testing sessions as a way to collect profiles and create a motivating and exciting milestone within your program.
You can structure these testing days, however you like, use the above protocols as a starting point when structuring your testing days
Applications for the load velocity profile
While profiling a single session is certainly fun and interesting, profiling really shines when we start comparing profiles over time, or between athletes to highlight changes in performance.
This is why I'm such a big fan of high frequency profiling, you can capture an accurate picture of how your athletes performance is changing in regular training and how they are responding to their program. The ability to flag, trans early and make adjustments is a monster advantage in training.
Competition and comparison
The load velocity profile is a great way to create fair competition between your athletes building a motivating and challenging gym culture. You can do this by simply comparing side-by-side. The shape of two athletes load velocity profiles, or — as you will soon learn — calculate a profile score, such as the e1RM and create a leaderboard on that score.
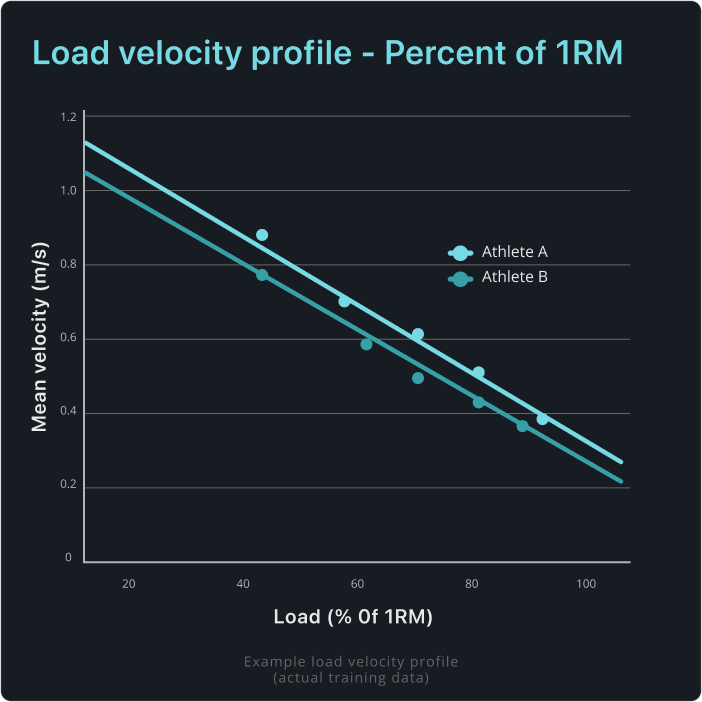
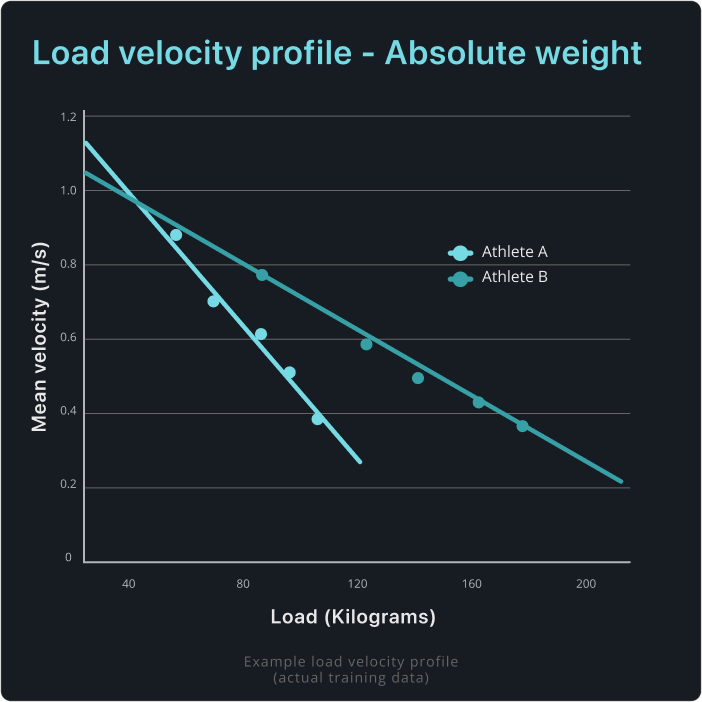
It’s important when competing on profiles that you take note of how you determine the X axis.
When creating a load velocity profile, there are three options for creating your chart; percentage of one rep max, relative to bodyweight, or absolute load lifted. Depending on which option you go with, will determine what qualities your highlighting.
When comparing between athletes, particularly field spot athletes I find that looking at profiles in terms of multiples of bodyweight is the best way to go about. VBT charts that use percentage of 1RM tend to be the most deceptive, especially when comparing between different individuals.

Fatigue monitoring
I really simple effective way to use the load of velocity profile, is to track fatigue levels specific to each exercise in your training. We can do this really easily by simply looking at the shape of your load velocity profile today compared to your last workout.
Ideally, your load velocity profile should be slightly bigger every session, either lifting the same weights slightly faster or lifting heavier weights at the same velocity. When we are fatigued, bar speed is one of the first things to suffer, so any time today's load velocity profile is below last sessions. This can indicate residual fatigue and reduced performance. Which might present an opportunity to apply autoregulation.
Tracking strength progress
Just like the load velocity profile allows us to compete between athletes it also allows us to compete with ourselves, trying to best a previous version of ourselves to create a bigger and better load velocity profile. One simple way to do this by just looking at the shape of your chart and overlaying them on each other with today compared to last session, last month, or last year.
Load velocity profiling scores
Beyond just visually comparing profile chats, the other way to track strength progress is with a profiling score,. Taking the raw data from our load velocity profile, applying some calculations and finding a specific number that quantifies performance across all weights on that specific exercise each session.
There are a few options for this including e1RM, a performance index, and Vzero/Lzero.
Estimating one rep max
The most commonly used calculation taken from the load velocity relationship is to estimate a lifters 1 repetition maximum (e1RM) without having to actually complete a maximal set. This is done by finding the intersection between the load-velocity profile and a horizontal line drawn at the speed of your last rep before failure, also known as the minimum velocity threshold (MVT).
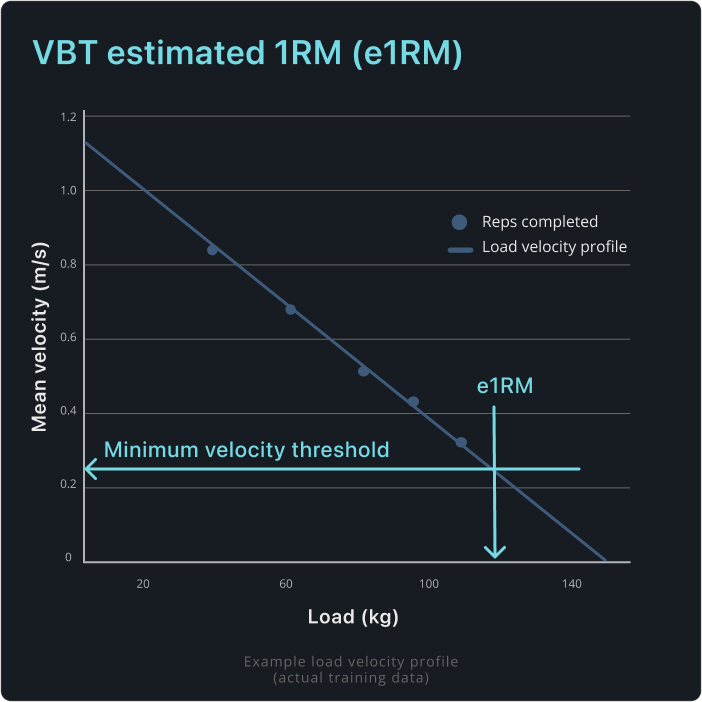
MVT is a well-researched area and while your own MVT value may be unique, it tends to fall within pretty consistent ranges for standard barbell lifts.

This method of finding the e1RM is not without its flaws, but your goal is to simply track progress and a rough indication of your 1RM (±5%) is fine then pick any old MVT and stick with it — you'll still reliably be able to track your strength gains over time. If, however, your goal is to use this ERM as a way to autoregulation to your percentage based training program then finding an e1RM that more closely reflects your actual strength levels (±2.5%) becomes more important.
you can read more about how to go about using velocity bass training to find e1RM in this article →
Vzero & L zero
These two scores takes the load velocity profile and extend them out to our theoretical limits
By extending the load velocity profile, all the way up to the velocity and load axis, we can find the maximum load that would occur when velocity is 0 m/s (V zero), or the maximum velocity when load is 0kg / 0lbs (L zero).

While both scores are theoretical in nature, increases in each score relative to each other, can be indicative of performance on that exercise.
- An increase in the V zero score is an indication that your maximum strength potential is improving. This is a sign of better force production, and likely a sign your 1RM is going up.
- An increase in the L zero score is an indication that your explosive power and rate of force development is improving.
I quite like V zero is an alternative to e1RM for measuring max strength when finding a reliable MVT is not practical. I tend to use L zero less often, opting to use the power curve and maximum power expression instead. Strength movements like speed squats and concepts like speed-strength training zones aren't the best ways to build speed.
Performance index
This is my favourite progress tracking score of them all. The performance index takes the total area of your load-velocity profile and puts a single number on your performance by calculating the area of the triangle created by the shape of your profile, the Y-axis and the X-axis.
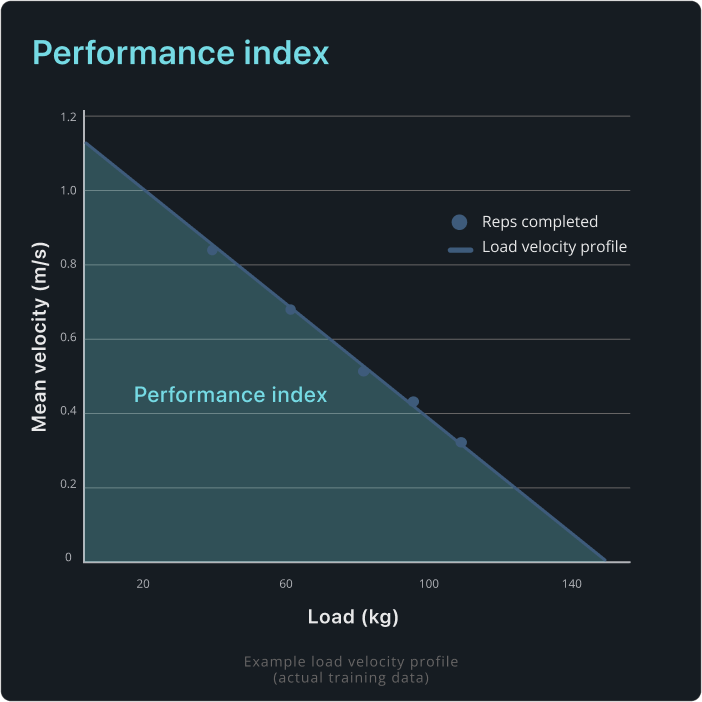
The equation is really simple. It's L zero times V zero divided by two.
The curve score can be calculated in absolute terms, giving a number somewhere in the hundreds typically, or the best way to use, it is relative to bodyweight, taking your role performance index and divide by an athletes bodyweight for a relative score (with a number usually between 2-5).
The relative performance index is great for both competition between athletes (create a monthly performance index leaderboard) or to track progress for a single athlete within the context of changing bodyweight, great for athletic development and weight class athletics.
Capture and use VBT data to create your own load velocity profile
Thanks to barbell velocity tracker apps like Metric VBT, and free online tools like the VBT coach load velocity profile calculator, regular profiling and performance tracking with velocity based training has never been easier.
Experiment with these profiling methods in your own training, track a few sessions, experiment with what scores resonate for you or your athletes and let your profile habits slowly evolve.
Here are two guidelines to help simplify your velocity and power profiling and get you started.
- Pick the key lifts you really care about. You don’t have to, and probably shouldn’t profile every single exercise in your training plan. At any given time I am usually only focusing on profiles for two or three exercises.
- Pick only one score per exercise. For me this is relative max power (W/kg) for my power cleans/trapbar jumps, and performance index (again relative to BW) for bench press, and trapbar deadlift or safety bar squat. * I don't track and perform all these exercises at once, but these are the staples of most of my programs.
Thanks for reading, any questions about load velocity profile feel free to get in touch you can reach me via DM on Instagram or in the VBT coach Discord.
References and resources
- Gonzalez-Badillo JJ, Sanchez-Medina L. 2010. Movement velocity as a measure of loading intensity in resistance training. Int J Sports. Med 3: 347–352.
.png)