VBT and 1RM. 1RM and VBT.
Since it’s inception, the number one use of velocity based training devices has been to calculate an athletes’ one rep max with a load velocity profile without having to perform a single max effort set.
This may be velocity based training’s most well researched utility, so read on to learn how you can start accurately tracking your 1RM strength levels every single workout, without having to max out or even do anything outside your regular scheduled programming!
Here is an outline of this detailed article if you want to skim ahead to the sections that interest you most:
- A Quick Primer on Velocity Based Training
- Why using bar speed to estimate strength if better than traditional approaches
- How to estimate 1RM Using VBT
- Bar speed tracking devices and apps
- Test protocols
- The Future of e1RM: Profiling and Progress Tracking
This article assumes solid understanding and familiarity with traditional one rep max testing, if not read that article first.
What is velocity based training (VBT)
You don’t need me to tell you, technology moves fast. In strength training, no technology has improved more or become more affordable than barbell velocity tracking devices and apps.
Velocity tracking, commonly still called velocity based training (VBT), which was coined by Dr Bryan Mann in the 90s, velocity tracking is a versatile set of methods and principles that have been scientifically proven to make athletes stronger, more powerful and increase athletic transfer compared to other training methodologies.
Velocity tracking has dozens of applications in training, it can be used to autoregulate training sessions, provide real-time feedback, motivate athletes and create competition, increase lifting intent, dynamically set fatigue thresholds via velocity loss, better optimise power training, calibrate RPE training programs and of course estimate 1RM!
Advantages of velocity based training to assess one rep max
Unlike traditional approaches to testing one rep max that require a rep max set or rely on subjective RPE values, VBT methods allow us to objectively predict 1RM strength from 3-4 submaximal reps.
Comparative Analysis: VBT e1RM vs Traditional 1RM formula
I have written at length in another post about the pros and cons of 1RM testing, but a simple side by side comparison underscores the advantages of using velocity tracking methods to estimate 1RM.
- No cost to training time (velocity data collected from regular training sets)
- Testing is submaximal so no residual fatigue in the days after testing
- No additional risk of injury or compromised lifting form
- No failed reps as all loads are below 85%
- Can be done every single workout (allowing you to collect a rolling average and be more reactive to changes)
- Proactively highlight drops in strength levels to adjust programming
- Set precise and dynamic loading percentages based on actual daily strength levels.
Principles of velocity based training estimated 1RM
In order to perform 1RM estimations with VBT, you need barbell velocity tracking technology of some kind, and two key velocity based training principles: the load velocity profile and the minimum velocity threshold.
Measure speed of a barbell
Historically, measuring bar velocity was an expensive and cumbersome thing to do. Devices either cost well into the $1,100s and were bulking, with complicated and unfriendly apps, or in the case of many accelerometers, they were inaccurate and unreliable.
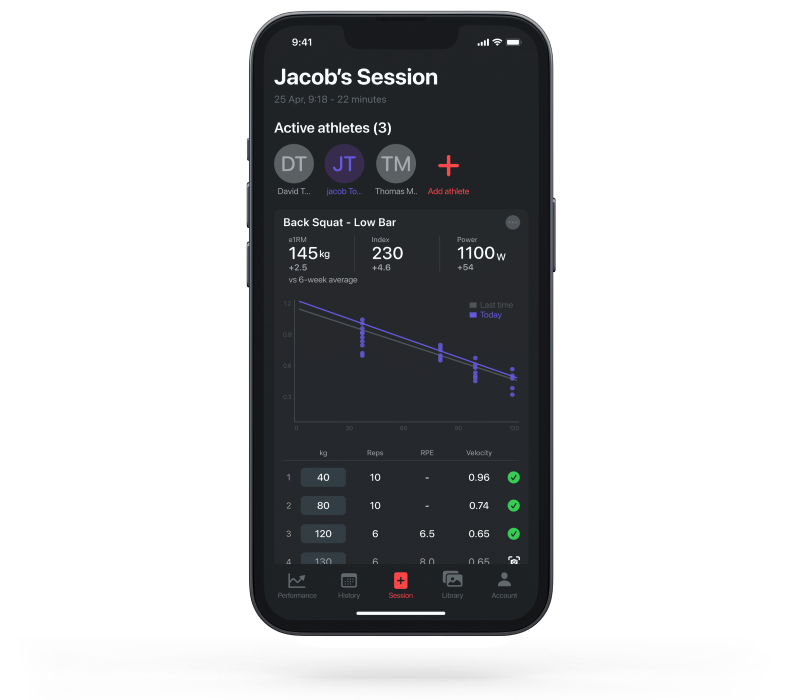
That has drastically changed in recent years as computer vision, AI, and phone camera technology has enabled huge improvements in the accuracy of bar speed apps such as Metric VBT.

Available on iOS, Metric is free to download, and free to record sets with a basic account (there are also Pro & Coaches options). Metric is intuitive, easy to use, accurate, and has externally validated.
You can download Metric on iPad and iPhone at this link. Full disclosure, I am one of the inventors and a cofounder of Metric. When I am not writing for VBTcoach I work at Metric as a developer and app designer.
Whether you use Metric, or choose another velocity tracking app or device, everything in this article still applies, including the VBTcoach load velocity profiling calculator.
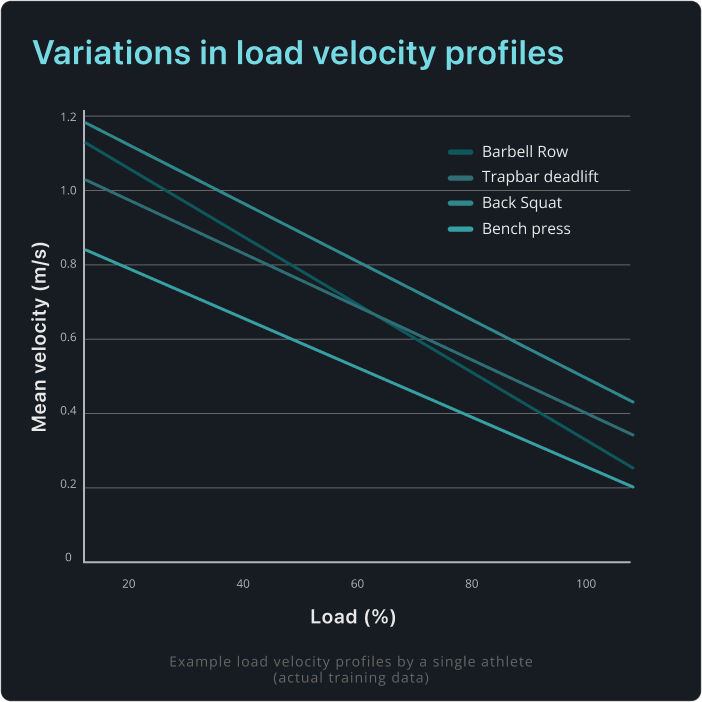
The load-velocity profile
To find your e1RM we need to establish a load-velocity profile, which shows the relationship between the load we lift, and the best rep velocity we can generate when applying good intent.
Each athlete will have a unique profile, and the profile will be different for each exercise (back squat vs bench press) and even for variations (full depth squat vs 1/4 squat, narrow grip vs competition bench press etc). The shape of your profiles will change over time as you become stronger and more powerful.
PIC, different profiles.
Minimum velocity threshold
Minimum velocity threshold (MVT) is the slowest speed (in mean velocity (m/s)) a lifter can lift at and still successfully complete a repetition. If the bar were any heavier, the rep would be too slow and the athlete would fail.
The point at which your load velocity profile intersects with the MVT is your predicted 1RM.
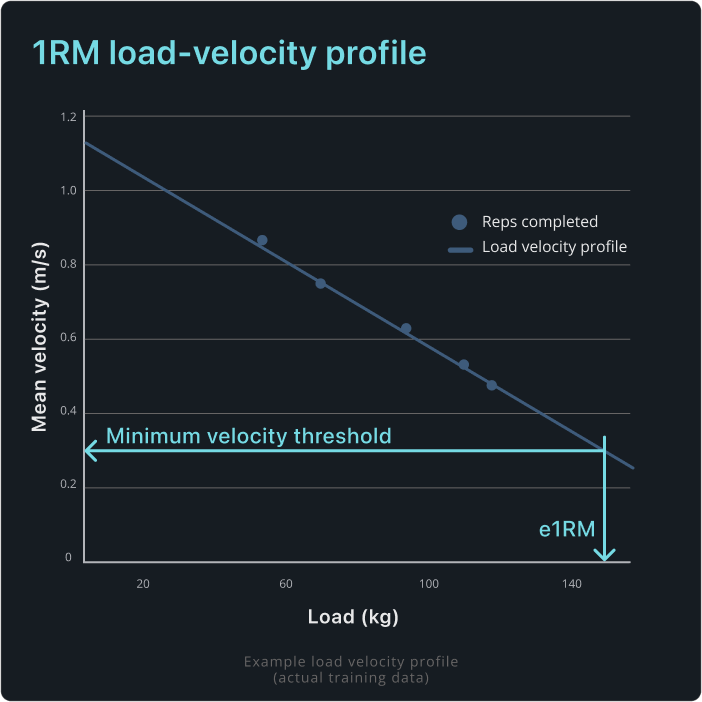
In practical terms this represents your ability to generate force and accelerate the bar to overcome gravity. Any less force (and therefore any slower) and you would fail to complete the rep.
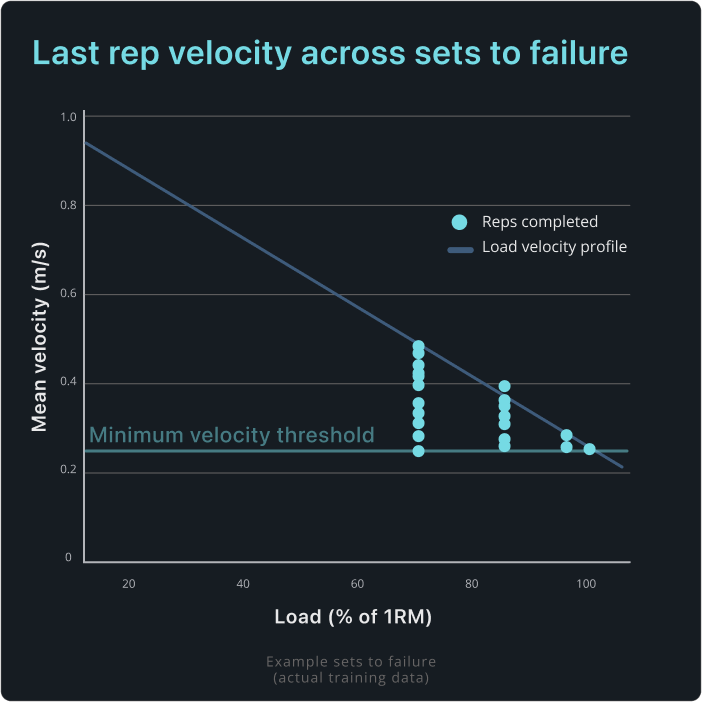
Just as the shape of an athlete’s load-velocity profile is unique, the MVT value is somewhat unique to a lifter, exercise and variation. It can also change over time - becoming slower as an athlete gets stronger - indicating better neuromechanical efficiency, force production and ability to maintain technique and tension under heavier weights. Incredibly strong powerlifters are able to complete deadlift reps as slow as 0.06m/s while for for a more intermediate lifter an MVT of 0.25m/s is much more typical. This represents a significant difference in e1RM calculated when the MVT value is individualised!
For lifters who do not plan on competing in powerlifting, don't stress the exact value of your MVT too much, what is more important is that you keep this value consistent over time, so you can track that changes in the e1RM as being changes in your profile, and not simply due to the change applied to your MVT.
Ball park a value in your first 1-2 testing sessions and stick with it.

For powerlifters, or if writing your programs requires accurate 1RM values to determine the percentage loads, adjusting your MVT once every 12-18 months might be required. You can do this by performing a max-rep set between 1-6 reps and using the velocity of your last rep as the MVT. This works because the last rep velocity for any rep max matches the speed of your 1RM.
Test protocols for finding the e1RM
Now that you have the theory locked down, it’s time to run a VBT 1RM test.
You have downloaded Metric VBT (or whichever VBT device you choose), picked a minimum velocity threshold, and now it’s time to collect some velocity data.
This is the easy bit, all you have to do is train as normal, completing your regular sets for the test exercise, and measure mean velocity on every set.
To get an accurate profile, you will need 3-5 sets across a wide range of loads. The top set should be somewhere between ~75-90% of your 1RM. It’s a wide range so roughly is fine, the top set just needs to be more work set than warmup.
As an example, for a 100kg bench press, you might do the following:
- 40kg x6
- 70kg x5
- 80kg x3
- 90kg x2
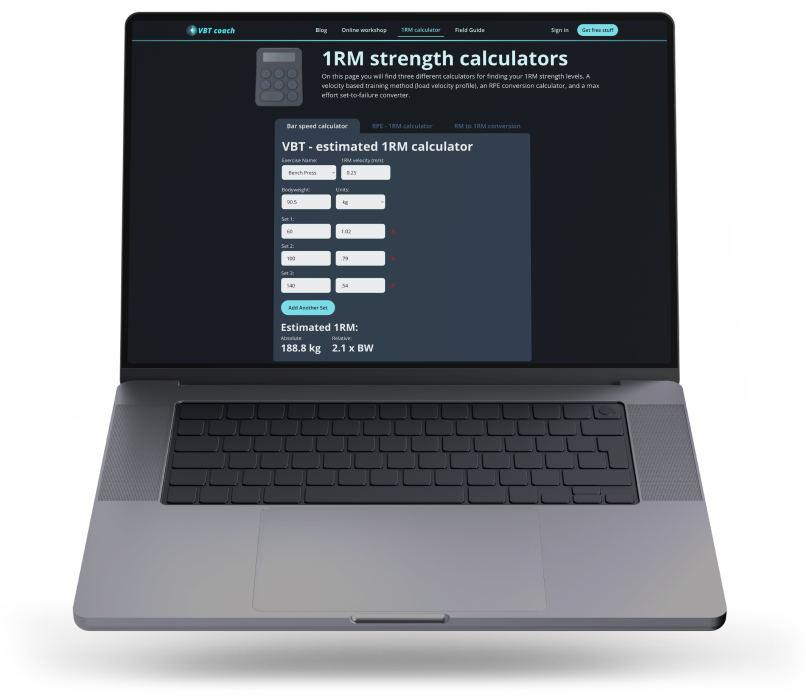
For each set you will want to write down the mean velocity of your fastest rep for each weight, plot these on a chart, and add in the linear trend line. You can do this with a pen and paper, in a spreadsheet, or the easiest option is to collect the data in Metric VBT and then enter the values into the free 1RM load-velocity profiling tool available on this website. The Metric VBT app also generates a lift profile automatically during your session.
Rest 2 minutes between the light sets (<60%), and extend this rest out to 3-4 minutes on the heavier sets.
Be strict on technique, no bouncing or flicking of the bar, avoid any cheating that might artificially inflate velocity. Any reps that have cheating should be discarded from the profile and use the next fastest rep from that set - in Metric you can review the video and even share it with a coach.
Train-as-normal 1RM data collection
Some research suggests you should use exact percentages of your 1RM for this testing protocol, (20%, 40%, 60%, 80% etc), but given the whole point of this is to estimate your 1RM, you likely don't know what your 1RM, I prefer to keep it simple and just use your standard warm up sets and first work set to create the profile. If you do this consistently the results will be more than accurate.
This short video from instagram highlights a 1RM data collection protocol with VBT in action - It look a lot like a regular training session!
The train-as-normal approach is the best option as it allows you to collect an e1RM score every single session, perfect if you then plan to use the e1RM in percentage based training, or simply to highlight fatigue and track performance with high precision (and no real time cost). Collecting a one rep max score every single session also becomes a great way to reward high intent for your athletes across all of their sets, increasing force production in the gym, making training more effective and making for biggest lifts and increased strength and power.
Thanks for reading, I hope this has been helpful!
References and resources
- Gonzalez-Badillo JJ, Sanchez-Medina L. 2010. Movement velocity as a measure of loading intensity in resistance training. Int J Sports. Med 3: 347–352.
- Balsalobre-Fernandez et al. 2017. Load-Velocity Profiling in the Military Press: Effects of Gender and Training.
- Ruf, L., et al. 2018. Validity and Reliability of the Load-Velocity Relationship to Predict the One-Repetition Maximum in Deadlift
- Garcia-Ramos, A. et al. 2019. Reliability and Validity of Different Methods of Estimating the One-Repetition Maximum During the Free-Weight Prone Bench Pull Exercise.
- Garcia-Ramos, A. et al. 2019. The Load-Velocity Profiles of Three Upper Body-Pushing Exercises in Men and Women.
- Hughes et al 2019. Using a Load-Velocity Relationship to Predict 1RM in Free-Weight Exercise: A Comparison of the Different Methods.
- Lake, J et al. 2019. Comparison of Different Minimal Velocity Thresholds to Establish Deadlift One Repetition Maximum.
- Dorrell H, et al, 2020. Comparison of Velocity-Based and Traditional Percentage-Based Loading Methods on Maximal Strength and Power Adaptations.
- Dorrell H, 2019. The Application of the Load-Velocity Relationship as a Means of Dictating Resistance Training Intensity.
- Dohoney, J, et al. 2002. Prediction of one repetition maximum (1-rm) strength from a 4-6 rm and a 7-10 rm submaximal strength test in healthy young adult males.
- Braith, R.W, et al. 1993. Effect of training on the relationship between maximal and submaximal strength.
- Jidovtseff, B. 2011. Using the load-velocity relationship for 1RM prediction.
- Picerno, P. 2016. 1RM prediction: a novel methodology based on the force–velocity and load–velocity relationships.
- Reynolds 2006: Prediction of one repetition maximum strength from multiple repetition maximum testing and anthropometry
- Wood, 2009: Accuracy of Seven Equations for Predicting 1-RM Performance of Apparently Healthy, Sedentary Older Adults.
- Weakley, 2021: Velocity-Based Training: From Theory to Application.
- Thompson, 2021: A Novel Approach to 1RM Prediction Using the Load-Velocity Profile: A Comparison of Models.
- Pérez-Castilla, 2020: Validity of Different Velocity-Based Methods and Repetitions-to-Failure Equations for Predicting the 1 Repetition Maximum During 2 Upper-Body Pulling Exercises.
- Zourdos, 2016: Novel Resistance Training–Specific Rating of Perceived Exertion Scale Measuring Repetitions in Reserve.
- Greig, L 2023. The predictive validity of individualised load-velocity relationships for predicting 1RM: a systematic review and individual participant data meta-analysis.
- Marston, K, 2022. Load-velocity relationships and predicted maximal strength: A systematic review of the validity and reliability of current methods
- Hickmott L, 2022. The Effect of Load and Volume Autoregulation on Muscular Strength and Hypertrophy: A Systematic Review and Meta-Analysis
.png)